Discovering Mutations in fisheries-induced Selection of Zebrafish
Zebrafish Variant Calling Training Project
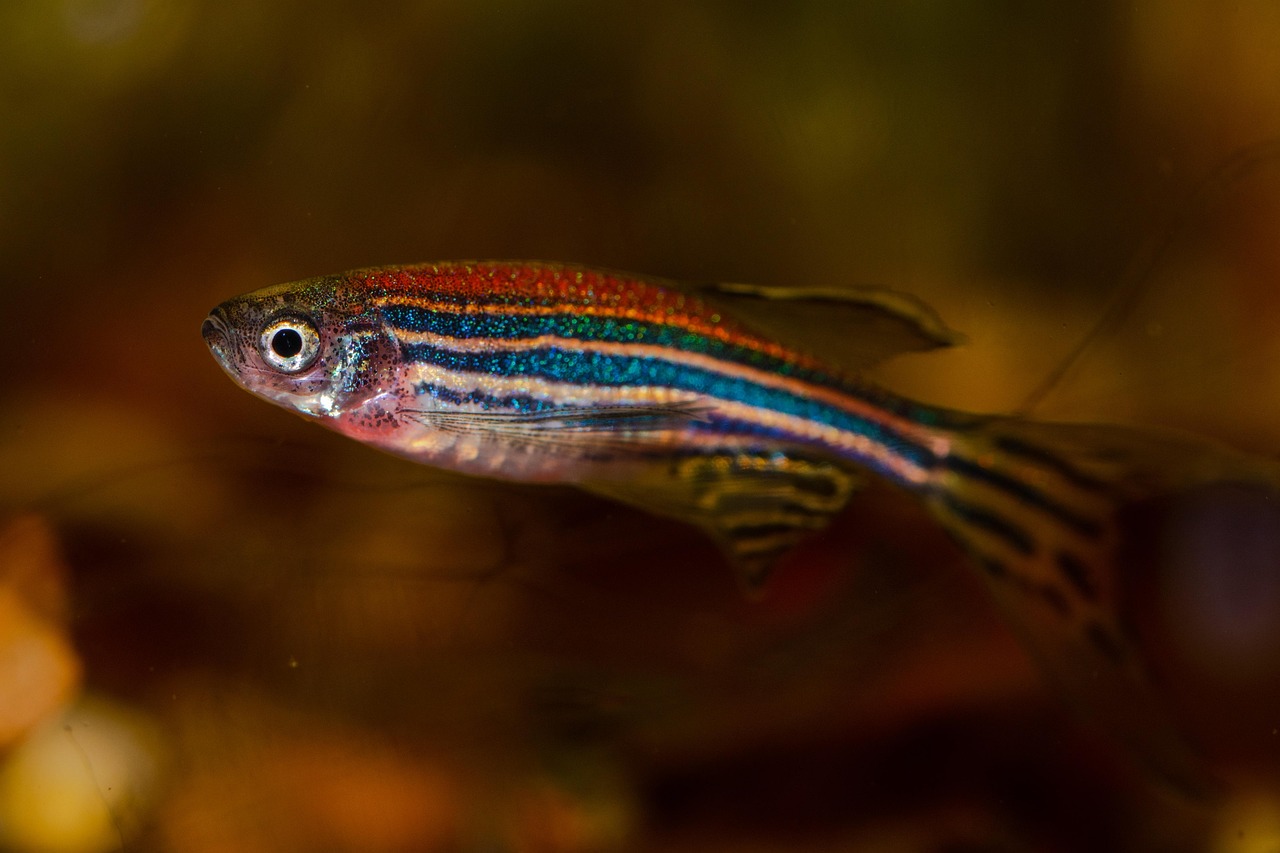
Image by Petr Kuznetsov from Pixabay
🐟 Variant Calling in Zebrafish
In this post, I document a hands-on training project I conducted using real sequencing data from the zebrafish study PRJNA630223. This study from University of Glasgow investigated how fisheries-induced selection (specifically simulated trawling) affects the genetic landscape of zebrafish, with a focus on how population density modulates these responses.
📚 The original study involved over 90 zebrafish samples, reared under different density conditions, gender and subjected to repeated harvest. However, my project only analyzes four samples for training purposes.
🧪 Objective
The goal of this project was to practice and understand the steps involved in a variant calling pipeline, from raw sequencing reads to functional variant annotation.
🧬 Data Used
I selected four male zebrafish samples, all from the baseline density group:
- 2 “Captured” fish: caught during simulated trawling
- 2 “Escaped” fish: those that evaded capture
This distinction is relevant because the study explores how behavioral traits like sociality or boldness may lead to capture-associated selection, potentially leaving genomic signatures that differ between groups.
📝 Sample details and Accession IDs:
- Captured1: SRR11676923
- Captured2: SRR11676919
- Escaped1: SRR11676853
- Escaped2: SRR11676862
🔬 Pipeline Overview
All steps were conducted using open-source tools within a Galaxy + Jupyter environment:
- Data download from
ENA - Quality control using
FastQC&MultiQC - Trimming low-quality reads using
fastp - Alignment with
minimap2 - SAM/BAM processing using
samtools - Variant calling with
freebayes - Filtering based on quality (
QUAL ≥ 20) usingvcffilter - Annotation using Ensembl’s
VEPwith a custom zebrafish GTF using Galaxy EU
📊 Results
Note: These results are purely descriptive and reflect only the four samples I selected for training. They’re not representative of the full study and aren’t meant to support any biological claims. Just to help me learn from real data.
1. Total Variants Per Sample
This bar plot shows the number of filtered variants (after QUAL ≥ 20) in each sample.
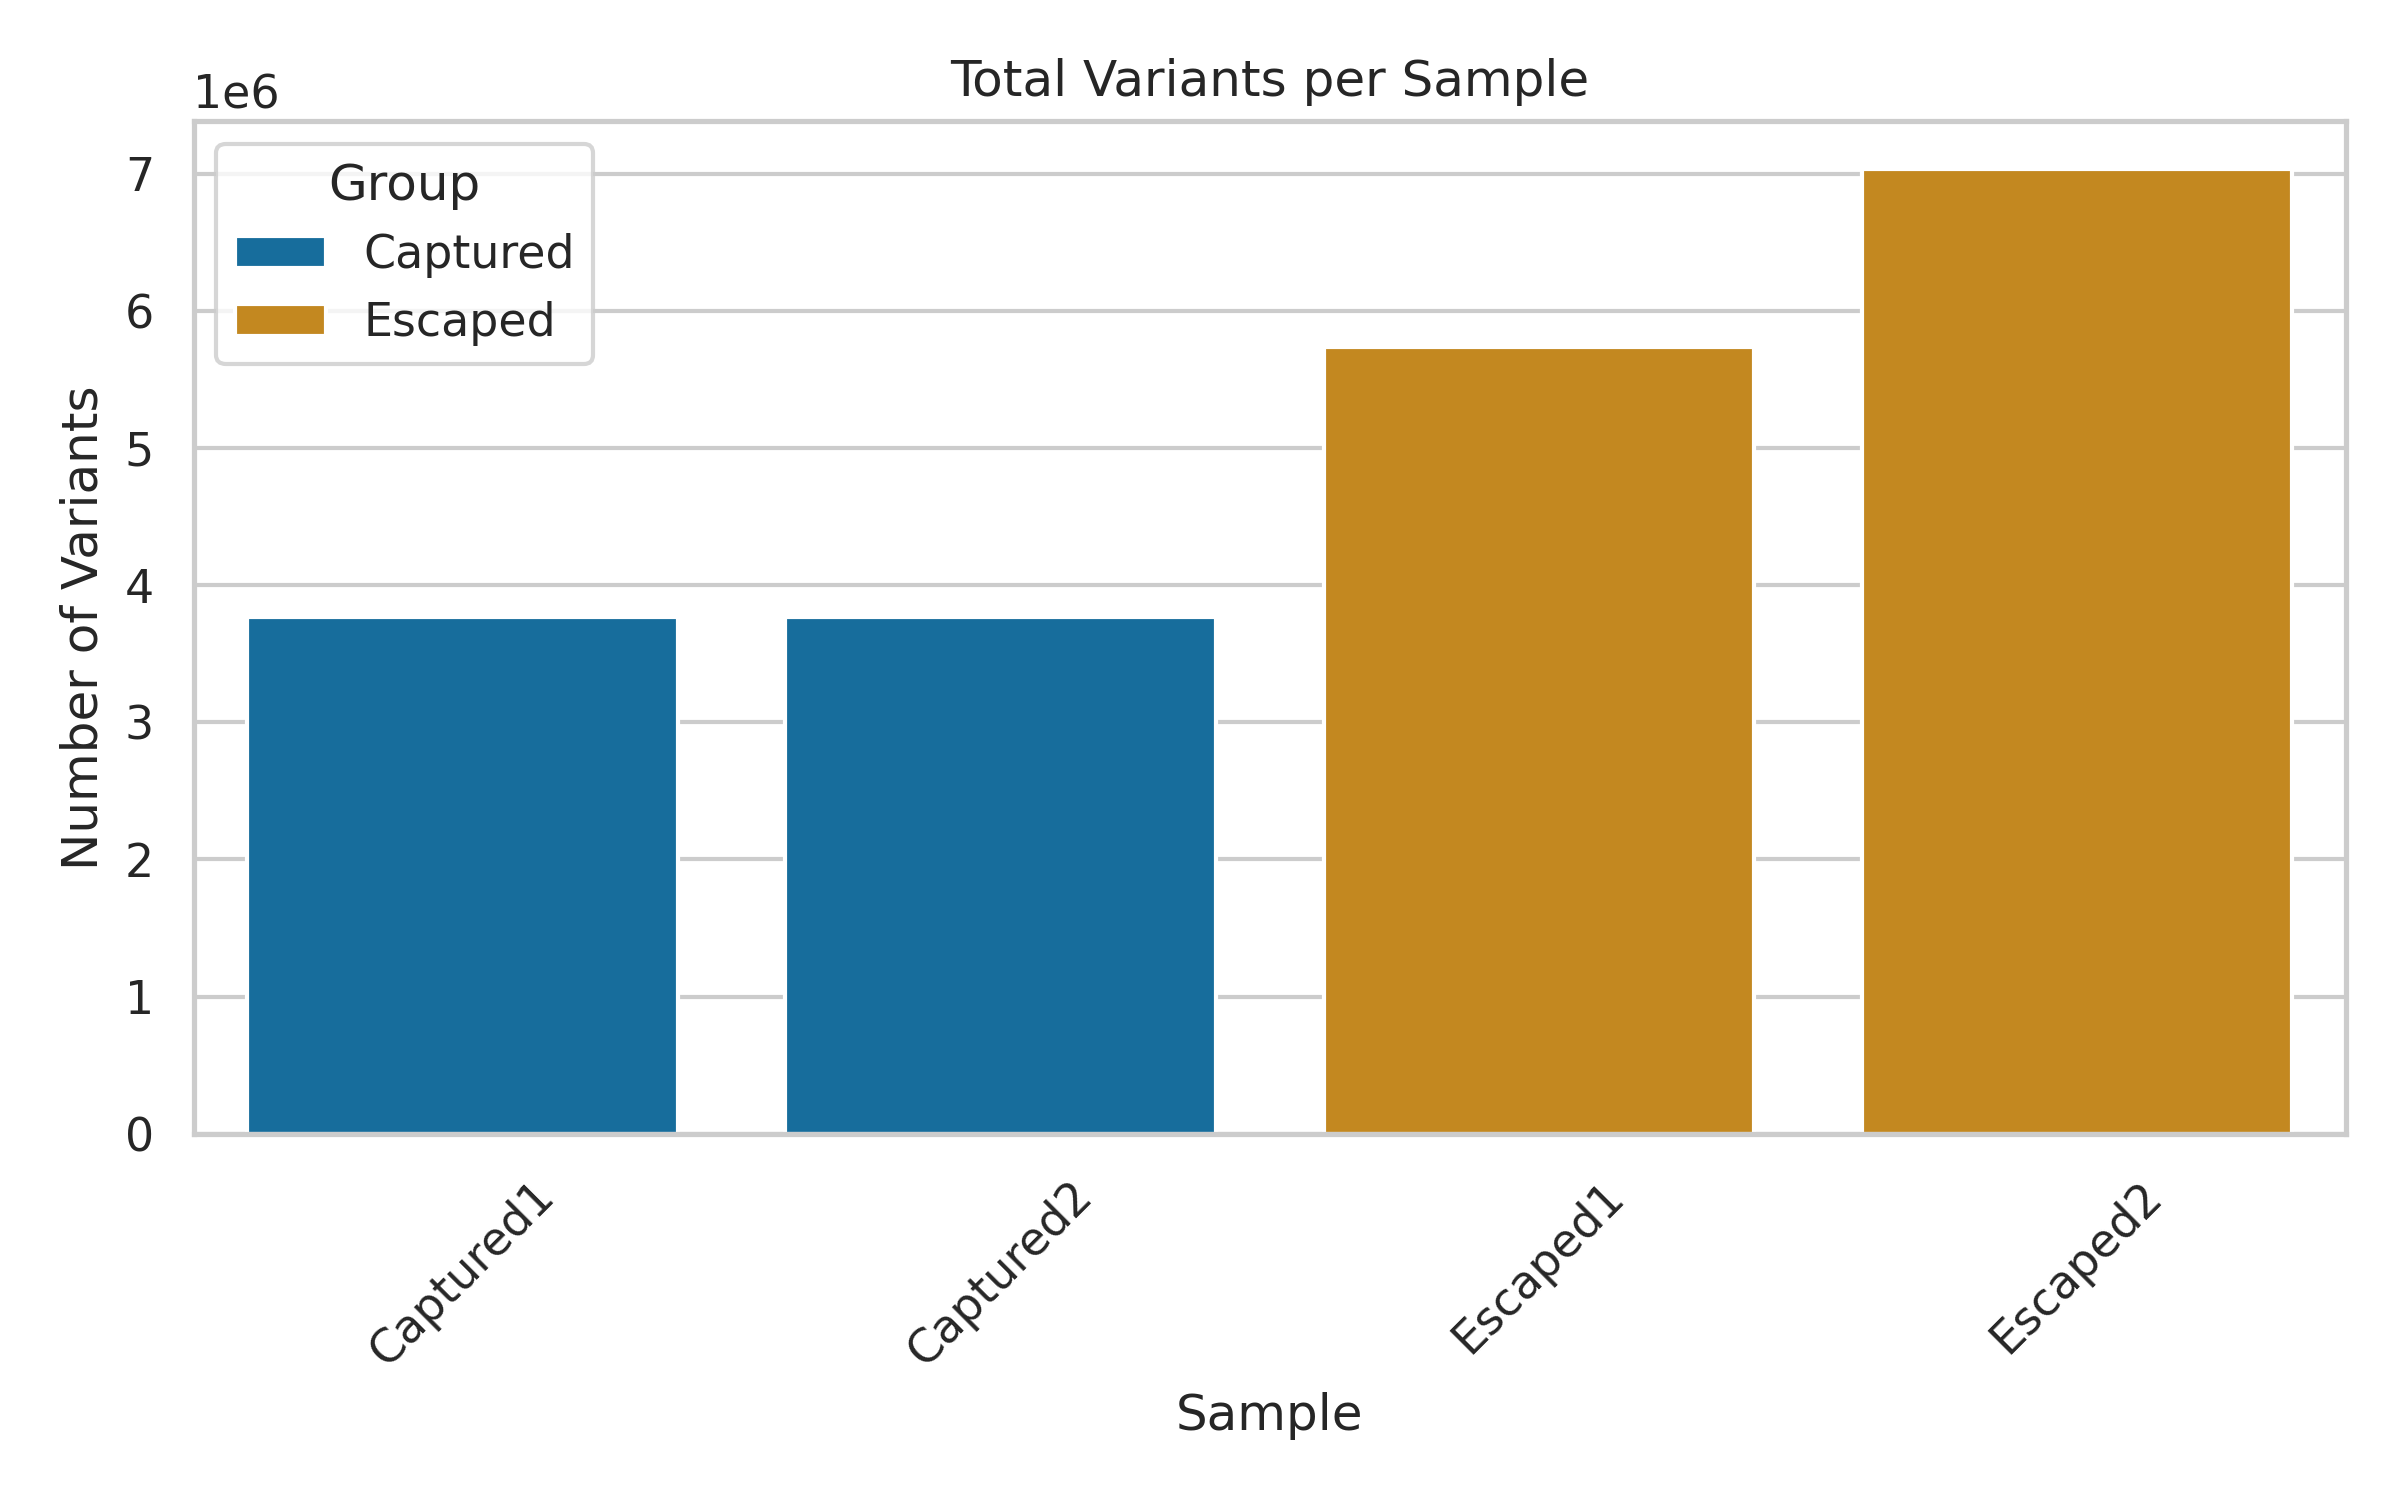
As seen above, escaped fish tended to have more total variants than captured ones.
2. Variant Impact Summary
Each variant was classified into one of four impact levels by VEP: HIGH, MODERATE, LOW, or MODIFIER.
| Impact Type | Captured1 | Captured2 | Escaped1 | Escaped2 |
|---|---|---|---|---|
| HIGH | 2691 | 2691 | 4157 | 4084 |
| MODERATE | 52516 | 52516 | 74768 | 79037 |
| LOW | 157776 | 157776 | 222393 | 235675 |
| MODIFIER | 7266476 | 7266476 | 11115424 | 13651472 |
The plot below compares their distribution across samples.
The plot excludes
MODIFIERconsequences, which dominate most genomes but are less informative in this training context and may obscure other types.
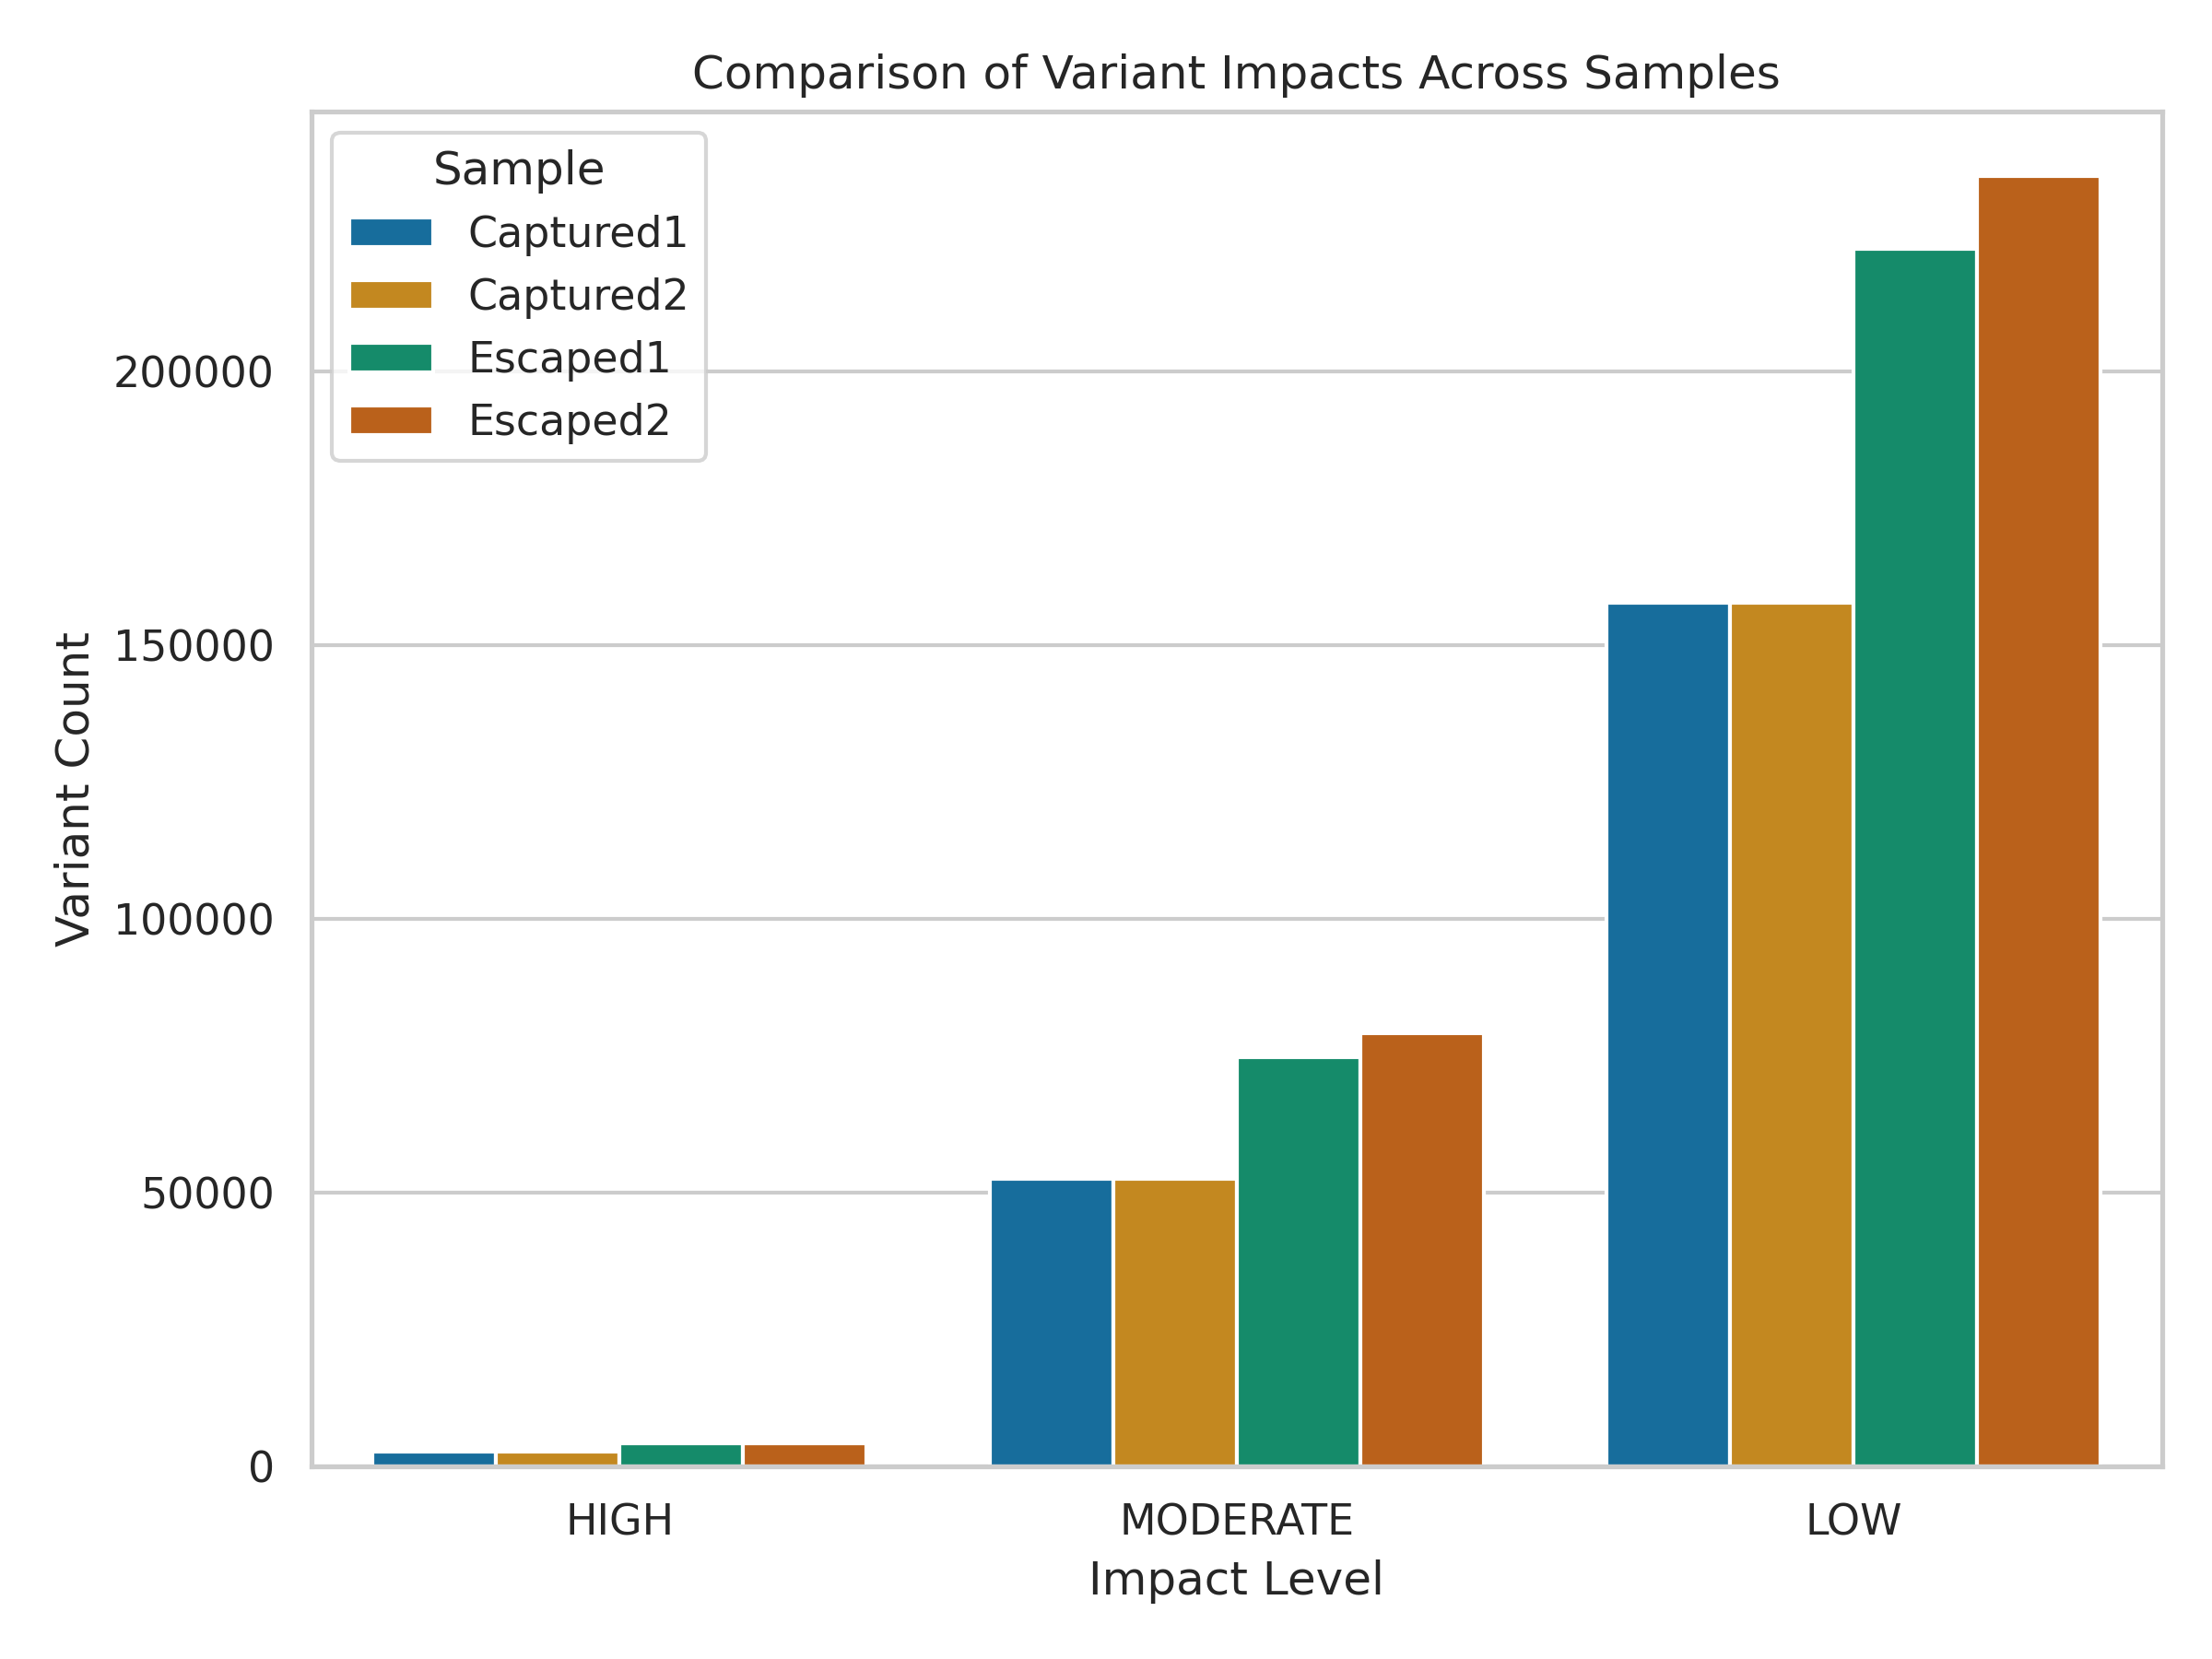
While LOW-impact variants dominate across all samples, subtle differences exist in the counts of HIGH and MODERATE variants.
3. Variant Summary Table
| Sample | Group | Mapped Reads | Total Variants | SNPs | Indels |
|---|---|---|---|---|---|
| Captured1 | Captured | 96.76% | 3765889 | 2947257 | 83926 |
| Captured2 | Captured | 96.76% | 3765889 | 2947257 | 83926 |
| Escaped1 | Escaped | 97.10% | 5734230 | 4459982 | 135088 |
| Escaped2 | Escaped | 97.51% | 7032765 | 5381912 | 189612 |
📌 All counts based on filtered variants only.
🧠 What I Learned
This project helped me solidify several key concepts in variant analysis:
- 🛠️ Practical tool use: I became more comfortable using
minimap2,freebayes,samtools, andVEPin a real workflow. - 📈 Data interpretation: I learned how to read and summarize variant call statistics meaningfully.
- 🎨 Visualization skills: I explored how to represent genomic differences clearly using plots.
- 🧭 Confidence for future work: This training project gave me a clear roadmap for scaling up future analyses, whether for zebrafish, humans, or microbes.
📂 Code & Pipeline
You can find the pipeline notebook and documentation here:
🔗 GitHub Repo Link
📚 Main Study
The Original study’s datasets can be accessed here:
🔗 ENA Project PRJNA630223
Original study Citation:
- Crespel A, Schneider K, Miller T, et al. Genomic basis of fishing-associated selection varies with population density. Proc Natl Acad Sci U S A. 2021;118(51):e2020833118. doi:10.1073/pnas.2020833118