Scroll 7: Thutmose's Trends
Welcome to Scroll 7 of 8, from the Djoser’s Bulk RNAseq Tutorial Codex.
In this scroll, we go beyond individual genes and step into the realm of functional and pathway analysis. Using our DEGs, we will investigate Gene Ontology (GO) categories and KEGG pathways to uncover the broader biological processes, molecular functions, and cellular components affected by our conditions.
Like Thutmose III, the strategic genius who expanded Egypt’s influence far beyond its borders, we will look beyond single genes to understand the larger systems and pathways shaping our results.
Let’s explore the bigger picture.
📜 Scroll Objectives
- Functional Enrichment Analysis
- Performing GO Enrichment Analysis
- Pathway Enrichment Analysis
- Performing KEGG Enrichment Analysis
- Cultural Spotlight: Thutmose III – The Conqueror Pharaoh of Egypt
Functional Enrichment Analysis
Functional enrichment analysis using Gene Ontology (GO) is a method to determine whether certain biological functions, processes, or cellular components are statistically overrepresented or Enriched in a given set of genes compared to a background set (often the whole genome).
In RNA-seq, we often end up with a list of differentially expressed genes (DEGs). While these lists tell us which genes are differentially expressed, they don’t directly explain what these changes mean biologically. GO enrichment bridges this gap.
Gene Ontology (GO)
GO terms are organized into three categories:
- Biological Process (BP): The biological objectives a gene contributes to (e.g., “apoptotic process”, “cell cycle”).
- Molecular Function (MF): The biochemical activity of a gene product (e.g., “ATP binding”, “DNA helicase activity”).
- Cellular Component (CC): Where in the cell the gene product is active (e.g., “nucleus”, “mitochondrial membrane”).
Why do we use GO Enrichment Analysis?
- Biological Insight: Instead of interpreting hundreds of genes individually, enrichment analysis summarizes them into higher-level functions or processes.
- Pattern Discovery: Identifies functional themes that might be driving the observed phenotype or condition.
- Hypothesis Generation: Highlights biological processes worth deeper investigation in follow-up experiments.
- Cross-Species Comparison: Since GO is standardized, you can compare findings across organisms.
If a specific GO term is significantly enriched in your DEGs compared to all genes, it suggests that the biological function represented by that term is likely involved in the biological condition or experimental factor you’re studying.
Performing GO Enrichment Analysis
To run GO enrichment, we’ll use the clusterProfiler package and org.Hs.eg.db which is the human organism database.
1
2
3
4
5
6
7
8
9
10
11
12
library(clusterProfiler)
library(org.Hs.eg.db)

# GO Enrichment
ego <- enrichGO(
  gene = DEGs$gene_name,       # The list of genes names for analysis (from our DEGs table)
  OrgDb = "org.Hs.eg.db",      # The organism database (here: Homo sapiens)
  keyType = "SYMBOL",          # The type of gene identifier we are using (SYMBOL = gene names)
  ont = "ALL",                 # Ontology: "BP", "MF", "CC", or "ALL" for all categories
  pvalueCutoff = 0.05,         # p-value cutoff
  qvalueCutoff = 0.05          # Adjusted p-value (FDR)
)
gene→ our DEGsOrgDb→ The organism-specific annotation database. For human, use “org.Hs.eg.db”.keyType→ Specifies the type of identifiers used in gene (e.g., “SYMBOL”, “ENSEMBL”, “ENTREZID”).ont→ The GO ontology category to search. “BP” = Biological Process, “MF” = Molecular Function, “CC” = Cellular Component, “ALL” = all categories together.pvalueCutoff→ A filter to keep only terms with raw p-values ≤ this threshold.qvalueCutoff→ A filter to keep only terms with adjusted p-values (false discovery rate) ≤ this threshold.
Making the Results Easier to Read
By default, the ego object is not in the most user-friendly table format. So we’ll convert it into a tibble, sort it by adjusted p-value, and filter only significant results:
1
2
3
ego.df <- as_tibble(ego, rownames = 'OntologyID') %>%
  arrange(p.adjust) %>%
  filter(p.adjust < 0.05)
Now, we can easily view it:
1
ego.df
This will display a table where each row represents an enriched GO term, along with statistics like the adjusted p-value, the number of DEGs annotated to that term, the description of the term and more.
Plotting & Interpreting the Results
We can use a dot plot to visualize a subset of the GO Enrichment Results, and for that we will use the enrichplot library
We will create a dot plot of the top 3 terms per each GO category (BP/MF/CC)
1
2
3
4
5
library(enrichplot)

# Dotplot - top 3 terms per each category
dotplot(ego, showCategory = 3, split = "ONTOLOGY", title = "Top GO Enrichment Terms: ~ BP/MF/CC")+
  facet_grid(ONTOLOGY ~ ., scales = "free")
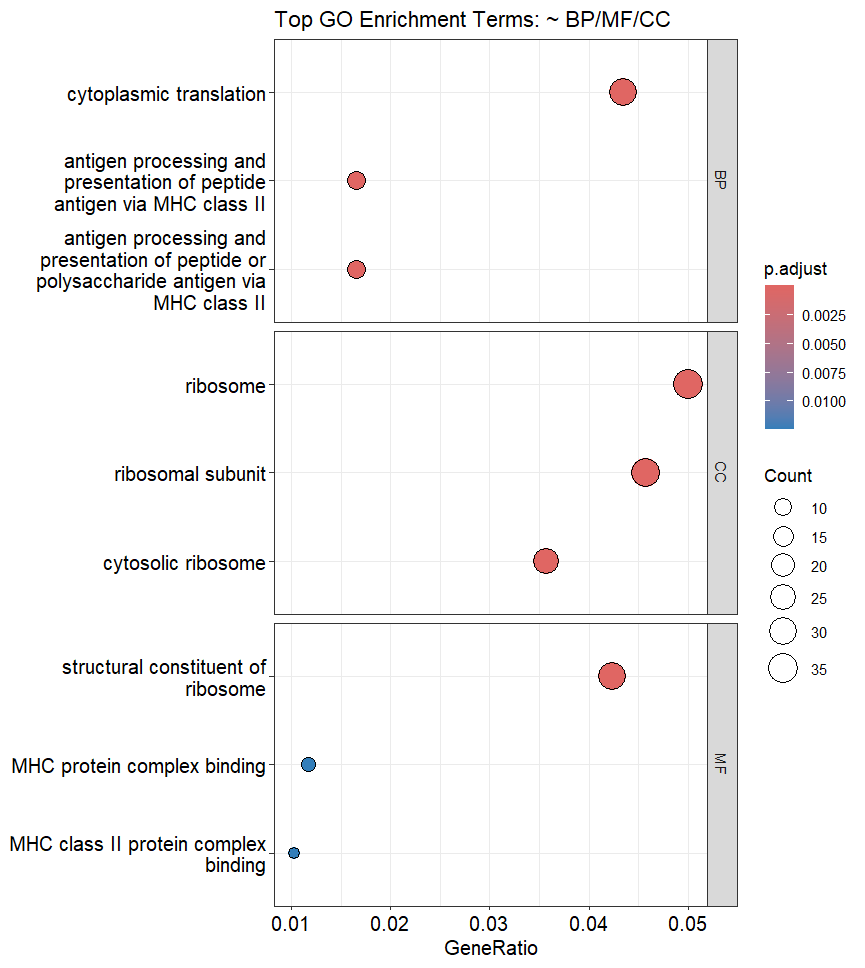
GO Enrichment Dot Plot
In GO Dot Plots:
- The warmer the color means higher statistical significance
- The bigger the circle means more of our DEGs share in this term (Gene Ratio)
so in our dot plot, for the Biological Pathways (BP), we can see that Cytoplasmic Translation is highly enriched, and highly significant followed by Antigen Processing.
These info can be used alongside Literature review to find connections and possible biological implications of the observed changes in gene expression.
Pathway Enrichment Analysis
KEGG (Kyoto Encyclopedia of Genes and Genomes) pathway enrichment analysis is a method used to determine whether a set of genes is significantly associated with known biological pathways.
These pathways represent networks of molecular interactions, reactions, and relationships in cells, for example, metabolic pathways, signaling pathways, and disease pathways.
It provides as much help as GO Enrichment Analysis in terms of Biological insights, Data reduction, Hypothesis generation and Comparison across studies.
Performing KEGG Enrichment Analysis
In R, KEGG pathway enrichment can be performed using the clusterProfiler package too, but we will need to get the Entrez IDs for each gene first.
we will create a gene.map where we will get the Entrez ID for each gene name using bitr()
1
2
3
4
gene.map <- bitr(DEGs$gene_name,
                 fromType = "SYMBOL",
                 toType = "ENTREZID",
                 OrgDb = "org.Hs.eg.db")
Then we will perform our KEGG Enrichment Analysis using enrichKEGG() and then convert the results to a tidy tibble for easier viewing
1
2
3
4
5
6
7
8
9
10
11
ekg <- enrichKEGG(
    gene = gene.map$ENTREZID,   # The list of genes in Entrez ID format
    organism = "hsa",           # 'hsa' specifies Homo sapiens
    pvalueCutoff = 0.05,        # p-value cutoff
    qvalueCutoff = 0.05         # adjusted p-value (FDR)
)

# Convert the results to a tidy tibble
ekg.df <- as_tibble(ekg, rownames = 'hsa') %>%
    arrange(p.adjust) %>%       # Sort pathways by adjusted p-value (most significant first)
    filter(p.adjust < 0.05)     # Keep only pathways with significant adjusted p-values
Plotting & Interpreting the Results
We can Plot the KEGG results on a dot plot in the same way as GO results.
1
2
# Dotplot - top 5 pathways
dotplot(ekg, showCategory = 5, title = "Top 5 KEGG Pathways")
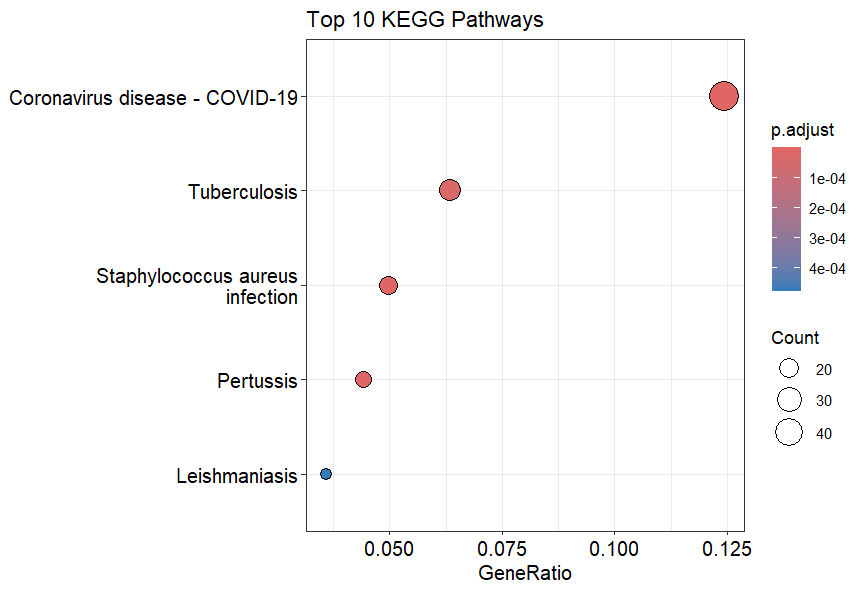
KEGG Enrichment Dot Plot
The KEGG dot plot is also interpreted in the same way.
here we can see that Coronavirus disease - COVID-19 is highly enriched, followed by Tuberculosis and Staphylococcus aureus infection.
Appearance of Infectious Diseases in KEGG results doesn’t directly imply the prescense of such infections, but implies a similar inflammatory and immune actions and responses similar to those found in such diseases.
We’re Done! GO and KEGG Enrichment Analysis are very powerful as they can quickly group a huge amount of DEGs into specific Pathways and Functions that can give meaning and ease interpretation of your data.
If you want to continue, head over to the next and final scroll: Djoser’s Discoveries, where we’ll perform Gene Set Enrichment Analysis (GSEA)
Time for our Cultural Spotlight!
🏛️ Cultural Spotlight: Thutmose III – The Conqueror Pharaoh of Egypt
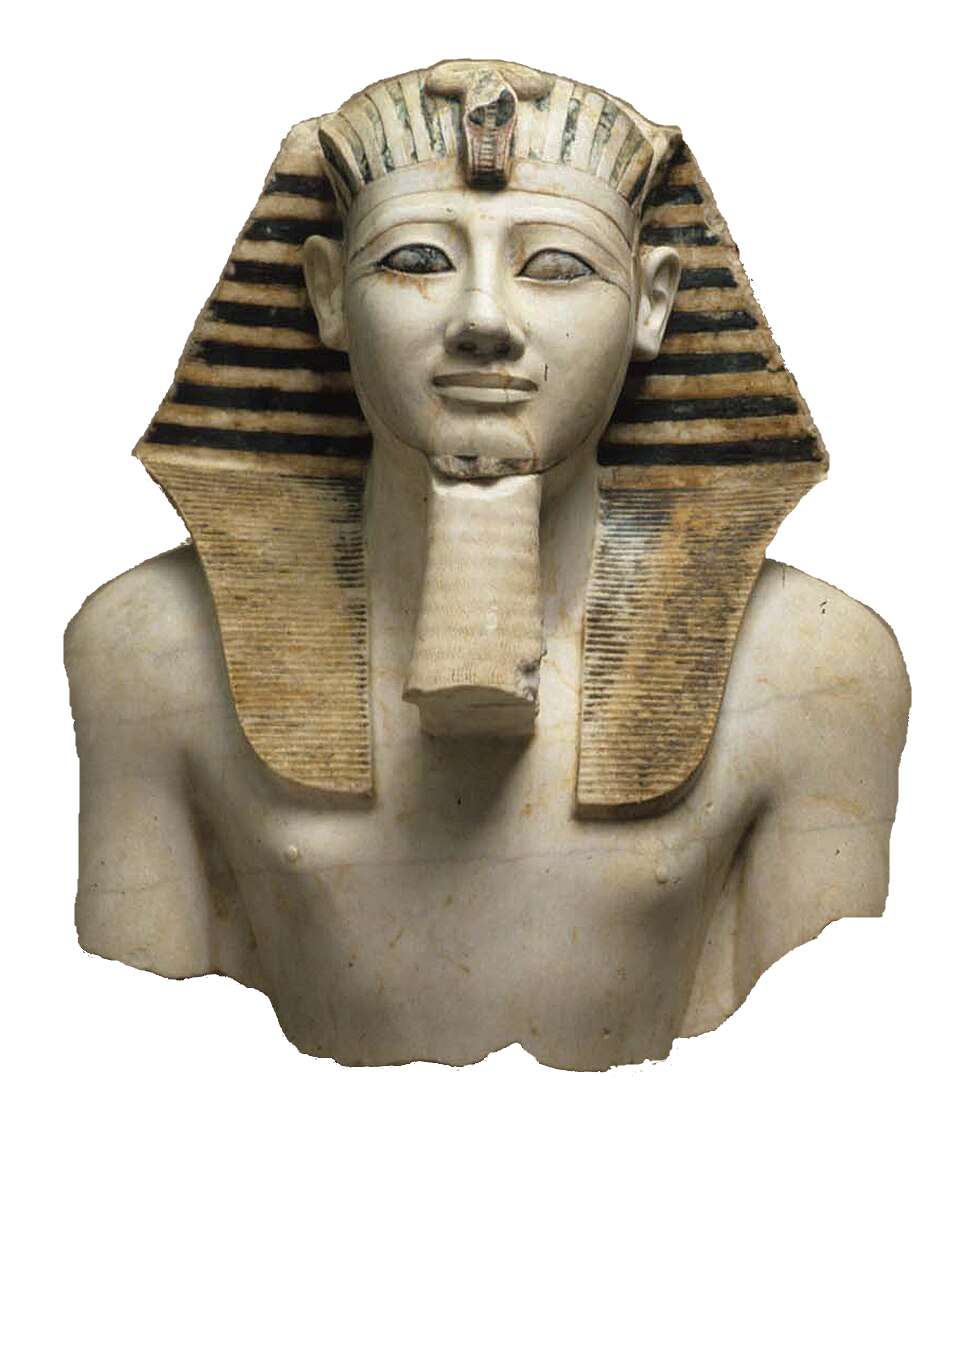
Thutmose III, often hailed as the Napoleon of Ancient Egypt, reigned during the 15th century BCE and is celebrated as one of the greatest military leaders in ancient history. Ascending to the throne as a young co-regent under Queen Hatshepsut, he eventually took full control and transformed Egypt into the most powerful empire of its time.
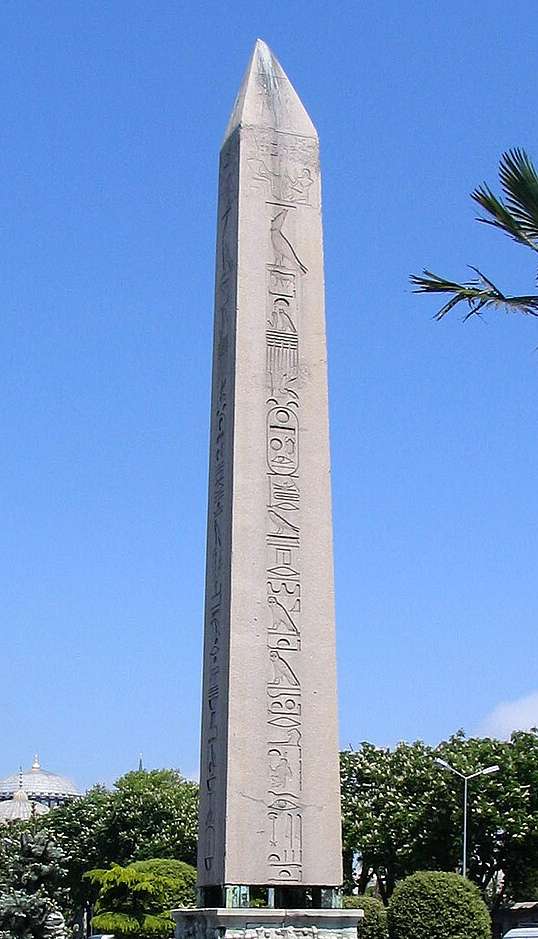
One enduring testament to his reign is the obelisk now standing in the Hippodrome of Constantinople (modern-day Istanbul). It was originally in Karnak, this granite needle bears hieroglyphic inscriptions that proclaim his glory, a monument that has endured thousands of years.
Papyrus Background from the Post’s Cover photo is from Freepik