Scroll 2: Hesy-Ra's Diagnostics
Welcome to Scroll 2 of 8, from the Djoser’s Bulk RNAseq Tutorial Codex.
In this scroll, we ensure our raw sequencing data is clean and reliable, the essential next step before diving into analysis. Like Hesy-Ra, one of ancient Egypt’s earliest scribes and physicians, we begin by inspecting and documenting our raw materials with care.
Let’s dive into Quality Control.
📜 Scroll Objectives
- What is Quality Control in RNA-seq
- Why QC Matters Before Analysis
- Common QC Tools for RNA-seq
- Installing FastQC & MultiQC on Google Colab
- Running FastQC
- Interpreting the FastQC Reports
- Bonus: Summarizing Results with MultiQC
- Interpreting the MultiQC Report
- Cultural Spotlight: Hesy-Ra – The Scribe of Teeth and Records
What is Quality Control in RNA-seq?
Before diving into transcriptomic analysis, we need to verify the integrity and reliability of our raw sequencing data. This is called Quality Control (QC), a critical checkpoint that helps us identify issues like:
- Poor read quality
- Adapter contamination
- Overrepresented sequences
- & Others
Skipping this step is like building a house without checking if your bricks are cracked. QC lets us catch problems early and decide if we need to clean (trim) or discard problematic reads.
Why QC Matters Before Analysis
Downstream RNA-seq analysis tools like DESeq2 or edgeR assume your input is clean. If poor-quality data sneaks through:
- Differential expression results can be misleading
- Mapping tools may fail or return fewer alignments
- Enrichment results could be irrelevant or incorrect
Performing QC ensures:
- Your data is trustworthy
- You don’t waste time analyzing flawed inputs
- You can troubleshoot with confidence
Common QC Tools for RNA-seq
Several tools are widely used for QC in RNA-seq workflows:
- FastQC:
- Generates interactive HTML reports summarizing read quality
- Most common, fast, and easy to use
- FASTP:
- Combines QC, trimming, and filtering in one tool
- Modern, powerful, but command-line only
- MultiQC:
- Aggregates reports from multiple tools into one view
- Great for large projects
For this tutorial, we’ll use FastQC, one of the most widely used and beginner-friendly tools for RNA-seq QC and MultiQC for report aggregation.
Installing FastQC & MultiQC on Google Colab
We’ll first install the tools.
Run the following code in a Colab cell:
- Installing FastQC:
1
  !apt install fastqc -y
- Installing MultiQC:
1
  !pip install multiqc
Running FastQC
Running FastQC is simple. You give it your FASTQ files, and it generates a report. You can also specify an output directory to keep things organized.
1
!fastqc {Your_FASTQ_file} -o {output_directory}
Since we have multiple samples, we can run FastQC on all of them at once:
1
2
3
4
5
6
7
8
9
10
11
12
13
14
15
16
input_dir = "/content/RNAseq"
output_dir = "FASTQC_reports"

# Our FASTQ sample IDs
FASTQs = ["SRR24448335", "SRR24448336", "SRR24448337", "SRR24448338", "SRR24448339", "SRR24448340"]

# Create output directory if it doesn't exist
if not os.path.exists(output_dir):
    os.makedirs(output_dir)

# Loop through each sample and run FastQC
for dataset in FASTQs:
    file_path = os.path.join(input_dir, dataset) + '.fastq.gz'

    # Run FastQC on the FASTQ file
    !fastqc {file_path} -o {output_dir}
FastQC will generate a .zip file and a .html report for each FASTQ file in the output folder. The HTML report is what we’ll use for interpretation.
Interpreting the FastQC Reports
After running FastQC, you’ll find an HTML report for each FASTQ file inside the FASTQC_reports folder. Open the .html file in a browser and explore the results.
Each section is color-coded:
- ✅ Green: Pass
- ⚠️ Orange: Warning
- ❌ Red: Fail
Don’t panic if you see some warnings or fails , many are expected in RNA-seq data and we will explain them later!
Here’s what to focus on:
Basic Statistics
This section gives a quick summary:
- Total number of sequences
- Sequence length
- GC content
Check that the total number of reads is what you expect and the GC content is within ~40–60% for human data.
Per Base Sequence Quality
This is one of the most important plots.
It shows the quality scores (Phred scores) across each base position in your reads.
- Great: Median scores stay above 28 across the whole read length.
- Watch out: If the quality drops significantly at the end, where we may consider trimming.
Per Base N Content
Shows how often the base ‘N’ appears (i.e., uncalled or uncertain base).
- Should be close to zero.
- If this is high, it might indicate poor sequencing quality.
Sequence Duplication Levels ⚠️
RNA-seq data often fails here. And that’s OK!
- RNA-seq involves sequencing highly expressed genes, so some sequences appear very often.
- Tools like DESeq2 or Kallisto account for this internally, so you can ignore this warning unless duplication is extreme.
Overrepresented Sequences
Lists sequences that appear more often than expected.
- Some overrepresentation is normal (e.g. highly expressed transcripts).
- Check the sequence source (if FastQC can identify it). If it’s from adapters or rRNA, you may need to trim or filter.
Adapter Content
Looks for sequencing adapter contamination.
- A small presence at the end of reads is common.
- If adapter levels are high, you should trim them off using tools like Trimmomatic, cutadapt, or FastP.
- In this tutorial, we won’t need trimming because our reads are already clean.
Should You Trim?
- If your quality drops severely at the end of reads, or there’s strong adapter contamination, consider trimming.
- For clean data (like ours), trimming isn’t necessary.
- We’ll cover optional trimming in a future scroll using a separate dataset.
Bonus: Summarizing Results with MultiQC
When working with multiple samples, it becomes tedious to manually open and compare each individual FastQC report.
That’s where MultiQC comes in.
MultiQC scans your report directory and automatically generates a single interactive summary HTML report that consolidates all FastQC outputs.
Why Use MultiQC?
- Saves time and effort
- Makes cross-sample comparisons easy
- Helps spot sample-specific issues
- Looks great in reports and presentations
Run MultiQC in Colab
Assuming you already installed it earlier:
1
!multiqc FASTQC_reports/
This will generate a file named multiqc_report.html in your working directory. You can download and open it locally to view all your results in one place.
Interpreting the MultiQC Report (Same as FastQC)
MultiQC aggregates all your FastQC reports into a single HTML file, making it easier to compare samples.
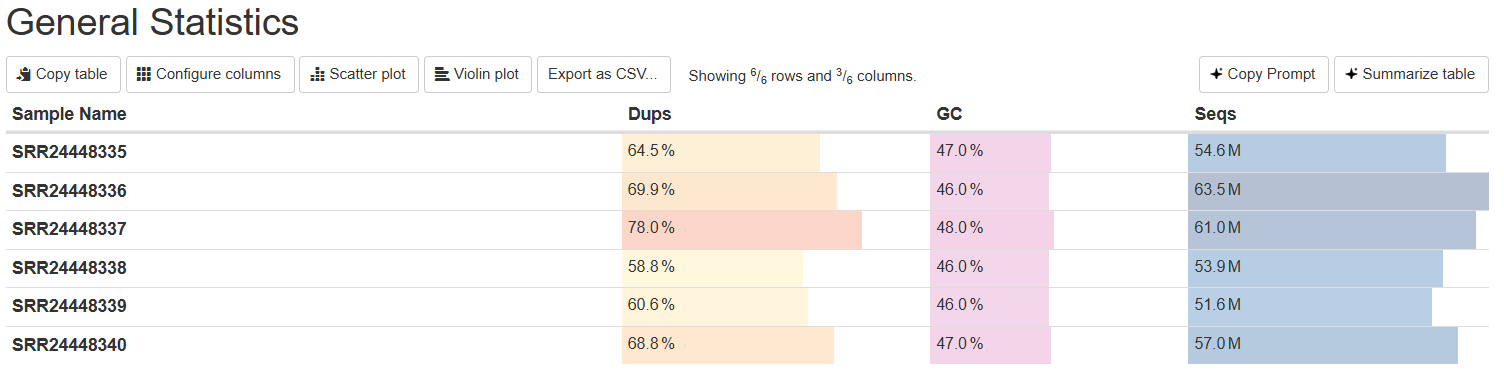
MultiQC Report - General Statistics
Here you can check multiple parameters for multiple samples at once.
That’s it! You’ve now looked under the hood of your raw data and checked that it’s clean and ready for quantification.
If you want to continue, head over to the next scroll: Khufu’s Calculations, where we’ll proceed with quantifying gene expression using Kallisto.
Let’s now take a cultural breath with our next Spotlight.
🏛️ Cultural Spotlight: Hesy-Ra – The Scribe of Teeth and Records

Hesy-Ra served during the reign of King Djoser and held titles such as Chief of Dentists and Physicians. But most importantly for us, he was a revered scribe, a role closely tied to record keeping, precision, and early scientific observation.
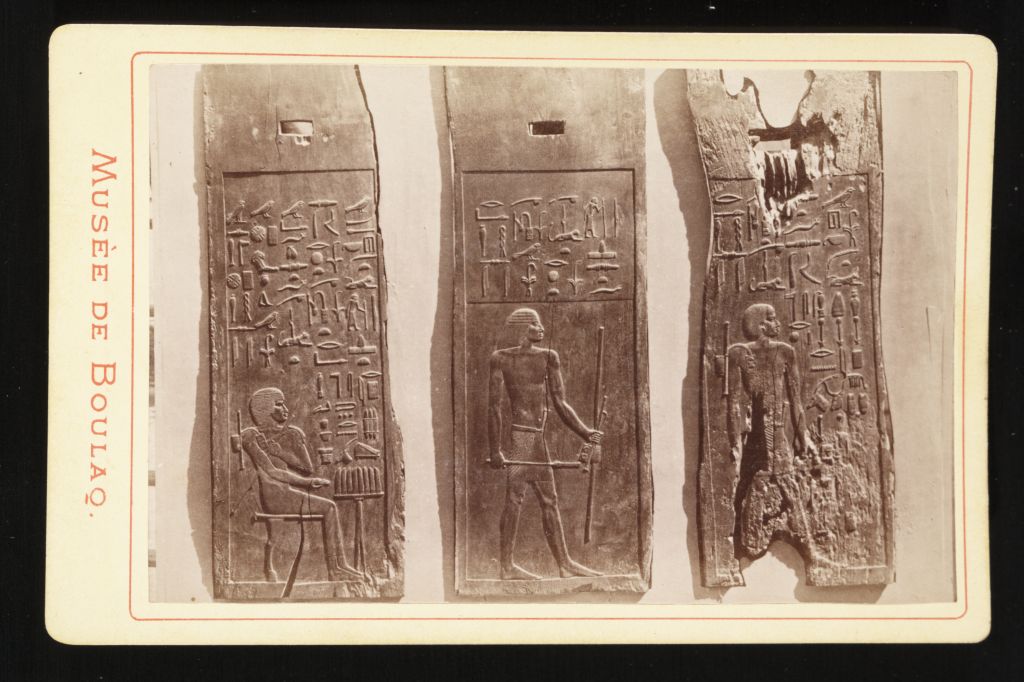
His tomb, found in Saqqara, contains some of the earliest examples of wood panel art and inscriptions. These are not just decorations, they’re some of the first recorded efforts to preserve knowledge across time.
Much like quality control in bioinformatics ensures the fidelity of our data before deeper analysis, Hesy-Ra’s work emphasized clarity, documentation, and order, the foundation of all future understanding.
Papyrus Background from the Post’s Cover photo is from Freepik